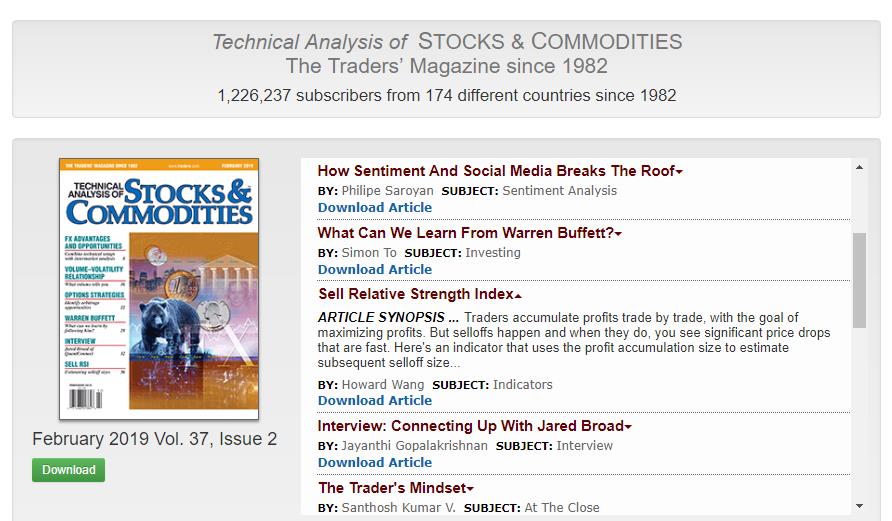
FTAA資深會員Howard Wang教授發表新作——《Sell Relative Strength Index(拋售強弱指標》)》,此文被刊登於美國著名金融類月刊《Technical Analysis of StockS & commoditieS》2019年2月刊中。目前,2019年2月刊已在http://traders.com/上線。

《Technical Analysis of Stocks & Commodities》 2019年2月刊
What Goes Up Must Come Down
Sell Relative Strength Index
Traders accumulate profits trade by trade, with the goal of maximizing profits. But selloffs happen and when they do, you see significant price drops that are fast. Here’s an indicator that uses the profit accumulation size to estimate subsequent selloff size.
——by Howard Wang
Newton’s law of universal gravitation indicates that gravity is an interaction between objects caused by the mass of the objects. The size of gravitation is related to the objects’ mass and the distance between the two objects. The greater the mass of the objects, the greater the attraction between them.
Earth has great mass and thus gravitational pull. When an object falls from a high level, it naturally accelerates its decline. After landing, it will rebound strongly and then continue to fall.
Newton’s law is very much in line with the ups and downs of the stock market. Traders and investors participate in the stock market to try to maximize profits. These profits may continue to accumulate and eventually trigger a selloff. The greater the accumulation of profits, the greater the profit-taking power will be. Eventually this will result in a sharp drop, which could end up being a correction or a market crash. We often see this type of action in the markets.
SELL RSI (SRSI)
Ideally, you would like to time your trades so you know when to sell off your positions before the market drops. Unfortunately, it’s not possible to do this, but the sell RSI (SRSI) indicator has some similarities to the law of universal gravitation. The SRSI is also called the sell gravitation index. As profits start accumulating, it’s likely to trigger a selloff action. But how much profit is the tipping point? It’s an interesting philosophical question.
The size of the selloff is related to the size of the profitable space. It also has to do with the emotions of greed and fear investors and traders always face. The higher the stock price rises, the greater the accumulated profits, then the greater the attraction for traders to sell, and the stock price will likely face a big drop. That is the power of greed and fear.
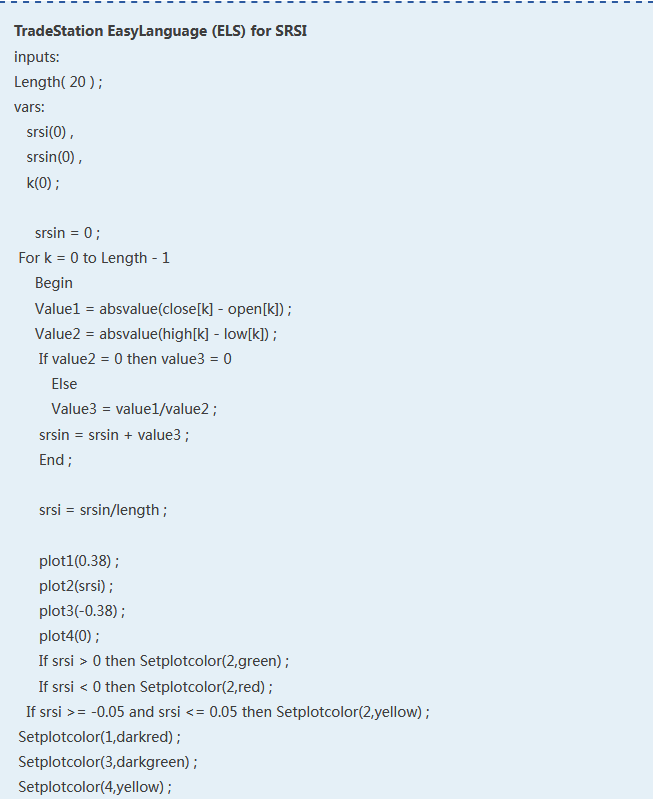
To put it simply, the SRSI describes the strength of the selloff compared with the size of the profit accumulation. SRSI is calculated using the formula formula shown in the sidebar “TradeStation EasyLanguage (ELS) for SRSI.”
APPLYING IT
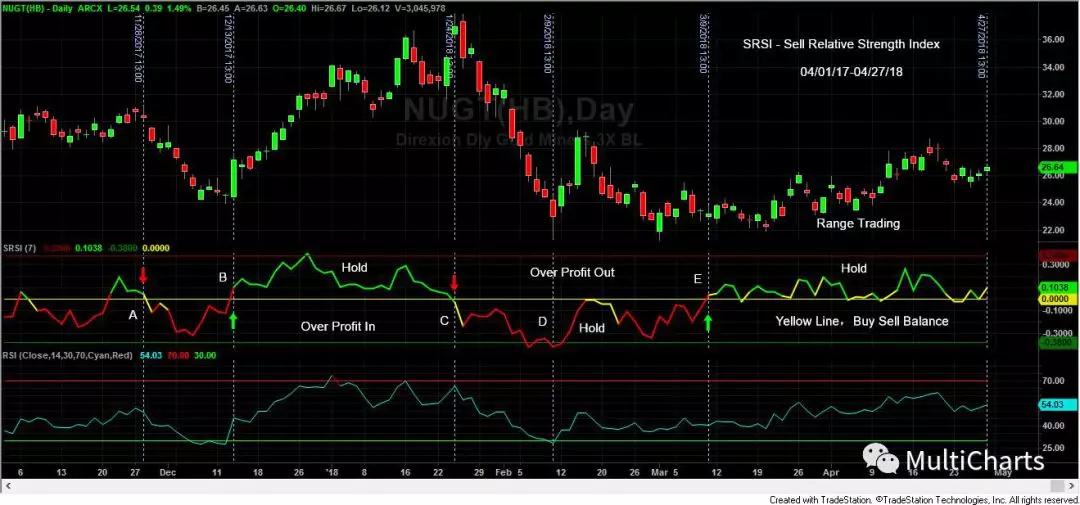
How is the SRSI different from the more popular relative strength index (RSI)? In Figure 1 you see a chart of Direxion Daily Gold Miners Bull 3X ETF(NUGT) with SRSI in the upper subchart and RSIin the lower subchart. Green lines represent buy, red represents sell, and yellow represents a balance between buy and sell, or hold. Points A, B, C, and E represent buy and sell signals on the SRSI. That is when prices move above or below the over profit line. The RSI gave a buy signal at point D. From point E onward, the SRSI suggests a hold since price is consolidating.
On the daily chart of QQQ in Figure 2, notice the buy and sell signals on the SRSI are more responsive than those from the RSI. At point A, the RSI didn’t give a confirming buy signal. At point B, the two indicators were in line.
Since SRSI is about selloffs, let’s take a look at the sell signals. Starting with sell signal C, notice how prices rallied quite a bit before the sell signal was generated. The RSI was in overbought territory for most of the rally. When RSI dropped below its 70 threshold level, traders could have sold their holdings in QQQ. But they may have been stopped out the next day. If traders had waited another day and sold when the SRSI generated its sell signal, they would have made a tidy profit. This is in line with the law of universal gravitation.


FIGURE 1: SRSI VS. RSI ON NUGT. Here you see that the buy and sell signals generated by the SRSI and RSI are different.
The SRSI gives a more responsive signal than the RSI at point E. The RSI didn’t reach overbought territory. If you were relying only on RSI, you may have missed a profitable short opportunity.
THe LAW OF GRAVITY
We all want to make profits from the markets, but as we know too well, the markets can take those profits away from us, and very quickly. By taking into consideration the range of the open and close relative to the high–low range, the SRSI is able to identify the size of the profi table space, and ultimately, project the size of a selloff.
Howard Wang has a master’s degree in mathematics and economic statistics, and has over 20 years of investment experience. He is particularly interested in analyzing technical indicators, candlestick construction, and designing breakout trading software and automated trading systems. He may be reached at tradesoftus@yahoo.com.
FURTHER READING
Wang, Howard [2016]. New Concepts In Trading: Profit Taking Theory (published in Chinese).
_____[2016]. “Waves And Profi t-Taking,”Technical Analysis of StockS & commoditieS, Volume 34: November.
_____[2015]. “The Breakout Relative Strength Index,”Technical Analysis of StockS & commoditieS, Volume 33: September.